

50/20/30 Rule
I discovered this budgeting rule several years ago and it honestly changed my life. It’s known as the 50/20/30 rule. When discovering this I was in my mid/late 20s and I was not in an ideal situation, financially. My debt-to-income ratio was a hot mess and there were several months where I was spending more money than what I was brining in. For several years this was happening for various reasons, but I won’t get into that! However, I was fully aware of this, but kept thinking to myself- “hey I’m fine and I’ll get things straightened out soon enough“. But thinking about doing something and actually doing it is where the difference lies.
Fast forward and I’m in a completely different place. Financial freedom and flexibility is an amazing thing. And I’m extremely proud to have gotten here. So, I wanted to share what I started to do several years ago and what I still do today- follow the 50/20/30 rule.
Ultimately, this is a rule of thumb to help establish a baseline budget and monthly spending plan. More specifically, where and how your income is allocated. It’s broken down like this:
- 50% toward Essentials
- 20% towards Financial Goals
- 30% towards Flex Spending
That should read as no more than 50% of income should go towards essentials, at minimum 20% towards financial goals, and no more than 30% towards flexible spending (non-essential). Now obviously everyone’s situation will be very different. At the time I started aligning my spending with this rule most, if not all, of my flex spending was going towards my essentials. Let’s say I was close to the edge of living beyond my means. And almost all of my financial goal spending was going towards debt reduction versus saving/investing. As I financially matured (along with career growth), majority of my flex spending went towards financial goals, specifically debt reduction. And ultimately more towards saving and investing.
I like to call the three components “buckets” and here’s how they’re broken down even further:
- Essentials
- Think of these items as required to live and play a major factor into your cost of living.
- Examples:
- Rent or mortgage (including taxes, insurance, HOA fees, etc)
- Food
- Electric bill
- Water bill
- Car Insurance
- Required service providers (wireless and/or internet)
- Financial Goals
- These can be any financial goals you can think of, anything from saving or reducing debt and can be short-term or long-term.
- Examples:
- Paying off a student or car loan
- Paying down credit card debt
- Saving for retirement (i.e. 401K, IRA, etc)
- Saving to buy a house
- Flex Spending
- This is pretty much everything else, anything non-essential. These are the nice to haves, like entertainment and dining.
- Examples:
- Netflix
- Spotify Premium
- Dining Out
- Amusement parks
- That unnecessary cup of Starbucks coffee
I explained this to someone verbally a couple years ago and they seemed to struggle with some of the flex spending and whether an expense was a flex or an essential item. My advice was simple, think of the absolute bare minimum expenses you would have if money got really tight. In other words, imagine if you lost your job (your only source of income) and you struggled to find a new job for several months- would you still pay to have cable or Netflix? I would certainly hope not, as that would be a flex spending type of item.
Another important thing I would suggest is to follow this budgeting model using your take-home money. That’s subtracting pre & post tax deductions from your paycheck and creating your budget model from there. This makes the model a little cleaner and straight forward. You’ll have to factor in that certain per-tax deductions could be for retirement (i.e. 401K). In my opinion, creating and executing on a budget is more achievable if the numbers can be tangibly realized.
Let’s look at an example.
Imagine someone just graduating college and they land a job with a starting salary of $50,000 a year (again, this is an example). Going from a low income, or no income, college student to having a steady/consistent paycheck could become troublesome if a budget is not created and followed. This scenario can be the case for anyone, not just recent college graduates.
Let’s take this fresh out of college person and assume their new employer offers a 401K and does a 100% match on a maximum 5% employee contribution. Obviously, the smart thing to do is to contribute that 5% ($2,500) in order to maximize the free money from the employer. Also, remember this amount is a pre-tax deduction and ultimately lowers your taxable income for the year. So, you’ll be saving for retirement and reducing your taxable income. It’s a win-win situation. Let’s layout some of the deductions in this example and ultimately figure out the monthly take-home amount.
| Item | Amount | Note |
| 401K | $2,500 (annually) | Pre-Tax deduction |
| Medical & Dental | $900 (annually) | Pre-Tax deduction |
| Taxable Income | $47,500 | Amount subject to income tax |
| Federal Income Tax | $7,867 | Federal Income tax & FICA |
| Annual take-home pay | $38,733 | Net Income |
| Monthly take-home pay | $3,227.75 | This will be our starting point |
Hopefully the above table of numbers makes sense, thus ultimately leaving a monthly take-home amount of $3,227.75. Taxes can get very complicated, so if you’re not understanding how to calculate your effective federal tax rate I would highly recommend looking into that. I thought about creating a post for this, but most likely not. Laws, tax brackets, various min/max amounts, etc, etc change every year. Not to mentioned the various state income tax rules around the country. I highly recommend smartasset.com to get a better handle on understanding how you’re taxed. In this example, let’s also assume this person resides in the state of Texas, so there’s no state income tax.
Back to our example. Below would be the distribution of our monthly take-home money ($3,227.75), if we were following the 50/20/30 rule exactly.
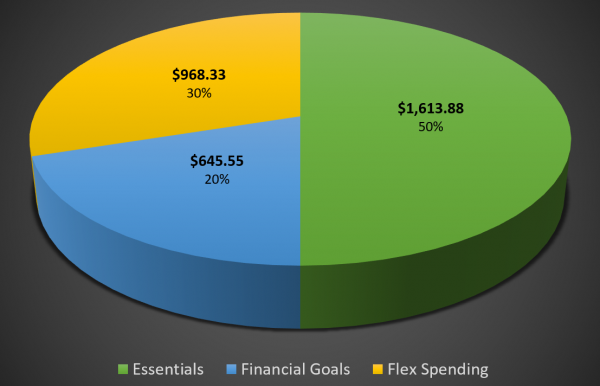
So, there’s your baseline budget per month, aligned to the 3 buckets.
- Essentials: $1,613.38
- Financial Goals: $645.55
- Flex Spending: $968.33
I’m sure there’s plenty of tools out there, but I actually created my own- simply using Google Sheets. I call it the Personal Finance Toolkit. This is nothing high tech and is a very simple tool to build out a budget and gain greater visibility into where your money is going. I created it over 6 years ago and continue to enhance it every once in a while. Services and apps like Mint or YNAB are legit and sound enticing. But, being a cyber security professional, it never felt right authenticating into my various financial accounts through these types of services. So, I’ve decided to follow the KISS principle here.
You can find the Personal Finance Toolkit here: https://ad3.in/budget-tool.
If you’re not familiar with Google Sheets- you’ll need to sign-in with your Google Account and select the option “Make a Copy” (under the File menu). Once you make a copy, of course you’ll be able to edit the entire thing, but be cautious as there’s tons of formulas and calculations all over the place. I did build in some data validation rules, so the sheet will prompt you if your editing a field that really should not be edited.
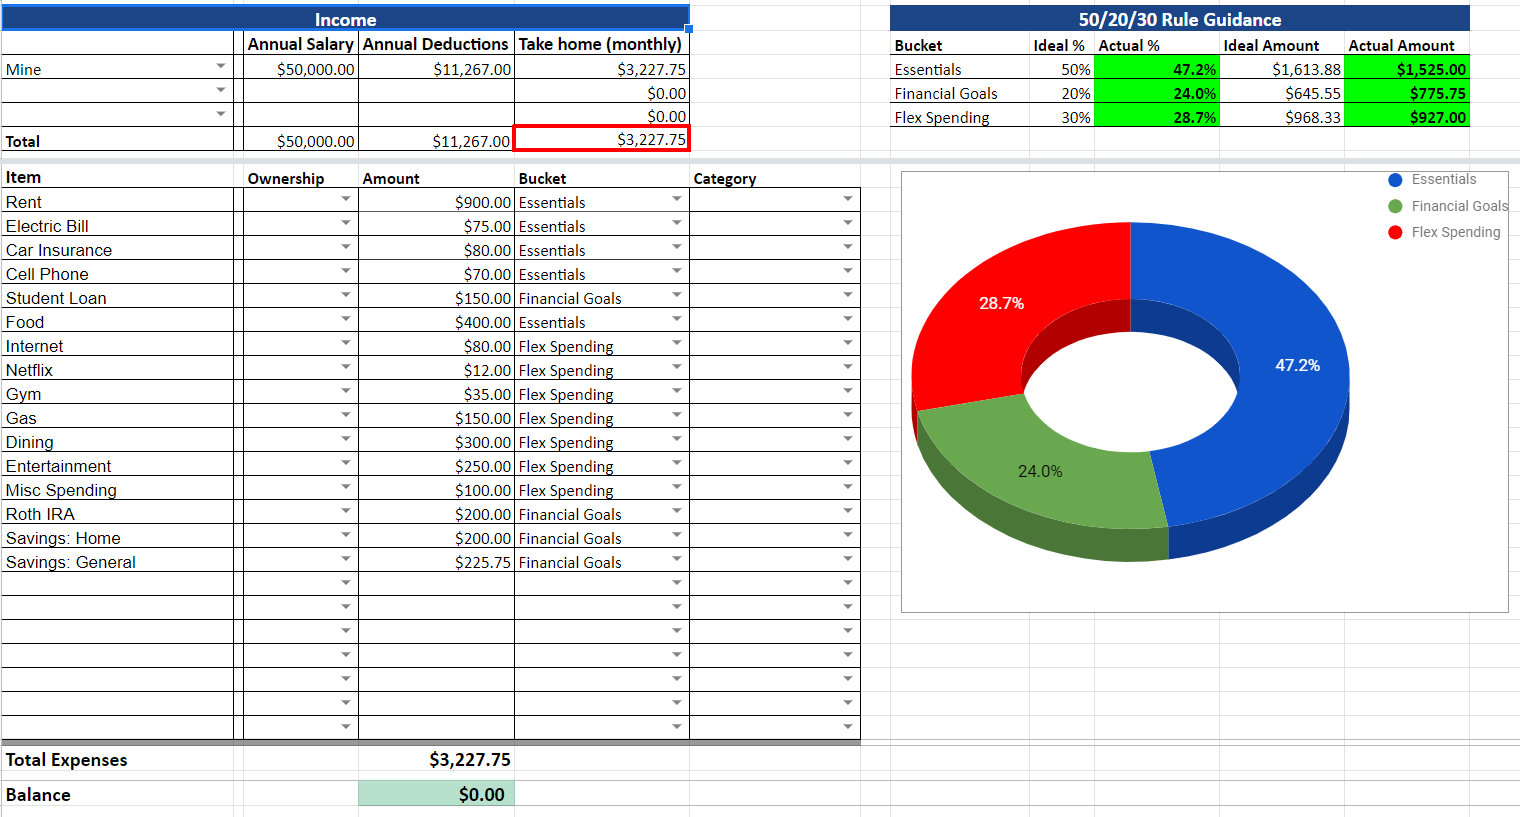
To follow along with this post and get the most value out of the spreadsheet, go straight to the “Budget” tab. Hopefully this is self-explanatory to get started. But I would follow these steps to get started:
- Navigate to the “Budget” tab
- Fill in Income info in upper left corner
- The default user is “Mine” (as in you!)
- Only 2 things need to be filled in here: Annual Salary and Annual Deductions- the rest is calculated for you. Ultimately, we’re trying to get to your monthly take-home pay. In the example, it’s $3,227.75.
- Tip: This is where it might be easier to simply use your take home amounts and not pre-tax/deduction amounts.
- Provide monthly expenses
- Underneath the Income information begin to start filling in your expenses
- To get started, only worry about 3 of the columns: Item, Amount, & Bucket
As you begin to fill in your monthly expenses, calculations will happen dynamically within the sheet. You’ll begin to see the donut chart fill in as you move between your expenses. Make sure you choose the correct bucket, the pie chart is derived from this info. In the upper right corner of the sheet you will begin to see your monthly budget and how it aligns to the 50/20/30 rule. If you’re within the guidance numbers you’ll see green and if outside, you’ll see red. Remember this is a rule of thumb, so don’t freak out if you see red. Back under your expenses, you’ll see your total monthly expenses and your balance. This is really all you need to do to get started with this.
Hopefully from this point you’ll now have a better picture of where your money is going. You may find yourself completely forgetting about something that you pay for every month (i.e. a gym membership). No worries, just go back to your personal sheet and update things.
So what about the rest of this sheet? What are all of these other tabs? I’ve been working on this spreadsheet for years and it’s much more than just a budgeting tool. The names of the tabs are exactly what they say. As you get a better handle on your budget, you can begin to use the rest of this spreadsheet if it is useful to you. For example, fill in your debt, savings, retirement, etc. Over time, you’ll be able to centrally view and track your progress towards financial health. The dashboard tab brings it all together and provides a snapshot of things. Just check out the “About” tab for more info and check back frequently as I intend to keep making updates to this.
Please free to drop any questions or comments about the 50/20/30 rule into this post and you can submit any feedback for the Personal Finance Toolkit here: https://ad3.in/pft-feedback.